Customer Lifetime Value (CLV) is all about figuring out the total revenue you can realistically expect from a single customer over the entire time they do business with you. It’s a shift away from just looking at short-term sales numbers and toward understanding the long-term profitability and true worth of your customer relationships.
Why CLV Is Your Most Important B2B Metric

Before we jump into the formulas, let's get clear on why Customer Lifetime Value (CLV) is such a game-changer for B2B companies. This isn't just another vanity metric for your dashboard; it's a strategic compass that should guide almost every part of your business.
Focusing on CLV marks a fundamental shift from chasing individual deals to cultivating sustainable, long-term growth.
Think of it this way: a massive one-time sale might look fantastic on a quarterly report. But a smaller, recurring contract with a loyal client often delivers far more value over the long haul.
Guiding Smarter Business Decisions
When you understand your CLV, you’re empowered to make much more informed decisions across the board. Knowing what a customer is truly worth lets you justify spending more to acquire the right ones and invest confidently in keeping them happy.
A solid grasp of your CLV helps you:
- Optimize Marketing Spend: You can finally set realistic customer acquisition cost (CAC) targets. If you know the average customer brings in $15,000 over their lifespan, spending $4,000 to acquire them suddenly makes perfect financial sense.
- Allocate Sales Resources: Your sales team can stop chasing every lead and start prioritizing prospects that fit the profile of your highest-value customers. All their energy goes where the return is greatest.
- Inform Product Development: By analyzing the CLV of different customer segments, you can pinpoint which features drive the most long-term value and loyalty, helping you decide what to build next.
A Barometer for Customer Health
At the end of the day, a strong CLV is a direct reflection of customer satisfaction and loyalty. Happy clients stick around longer, buy more, and are far more likely to become advocates for your brand.
A declining CLV, on the other hand, can be an early warning sign of problems with your product, service, or overall customer experience. By tracking this metric, you gain a powerful tool for diagnosing the health of your business.
We have an entire guide focused on improving customer lifetime value if you're looking for actionable strategies to boost this key metric.
Finding the Data You Need for Accurate CLV

Any CLV calculation is only as good as the data you feed it. Before you even think about plugging numbers into a formula, you have to get your hands on the right raw materials. Honestly, this is the step that separates a vague guess from a genuinely powerful business insight.
For B2B companies, especially those with complex contracts or SaaS models, digging up these numbers can feel like a chore. The good news? You almost certainly have this data sitting in systems you already use every day.
Your CRM, billing software, and analytics platforms are absolute goldmines. The trick is knowing which metrics to look for and how to stitch them together to paint a clear picture of what a customer is truly worth.
Locating Your Core Metrics
To get started, let’s hunt down the three essential pieces of the puzzle. Think of these as the core ingredients for your first CLV calculation.
- Average Purchase Value (APV): This is simply the average amount a customer spends with you in a single transaction. For a SaaS business, this is usually the average monthly or annual contract value. You can find this by dividing your total revenue over a period (say, a quarter or a year) by the total number of purchases made in that same timeframe.
- Purchase Frequency (F): This metric tracks how often a customer buys from you. A B2B software company with annual contracts might have a purchase frequency of just 1 per year. On the other hand, a consulting firm on quarterly retainers would have a frequency of 4.
- Average Customer Lifespan (L): This measures how long a customer sticks around. An easy way to estimate this is to look at your customer churn rate. For instance, if you have an annual churn rate of 20%, your average customer lifespan is five years (1 / 0.20). Simple as that.
Nail these three metrics, and you’ve built the foundation for a solid CLV model.
Navigating B2B Data Complexities
Gathering this data in a B2B setting often requires a bit more finesse than it does for a simple ecommerce store. Your billing system is going to be your best friend for finding contract values, while your CRM holds all the juicy details on customer start and end dates.
Here’s a quick cheat sheet on where to look:
| Metric | Primary Data Source | Secondary Source |
|---|---|---|
| Average Purchase Value | Billing Platform (Stripe, Chargebee) | CRM (Opportunity Value) |
| Purchase Frequency | Billing Platform or Accounting Software | Customer Contracts |
| Average Customer Lifespan | CRM or Customer Success Platform | Analytics Tools (Churn Reports) |
It's also impossible to talk about CLV without mentioning its partner in crime: Customer Acquisition Cost (CAC). While CAC isn't technically part of the CLV formula, you need to understand it to know if your customer relationships are actually profitable.
To get a handle on this, check out our simple customer acquisition cost calculator and see how these two powerful metrics work together. It’s the only way to know if your acquisition spending is paying off in the long run.
Your First Customer Lifetime Value Calculation
Alright, you've gathered your core metrics. Now it's time to put them to work and actually calculate your first CLV.
The most straightforward place to start is with the Historic CLV model, which looks backward at past data. This gives you a factual, hard-data baseline of what your customers have been worth up to this point. It's a great reality check.
While it doesn't predict the future, it’s the perfect launchpad. From here, we can jump into a simple but powerful predictive formula that B2B businesses can start using immediately.
The Simple Predictive CLV Formula
The most common and accessible way to calculate CLV is through a simple predictive formula. It’s a B2B marketer’s best friend because it just multiplies three key metrics—most of which you probably already have—to estimate the future revenue from a typical customer.
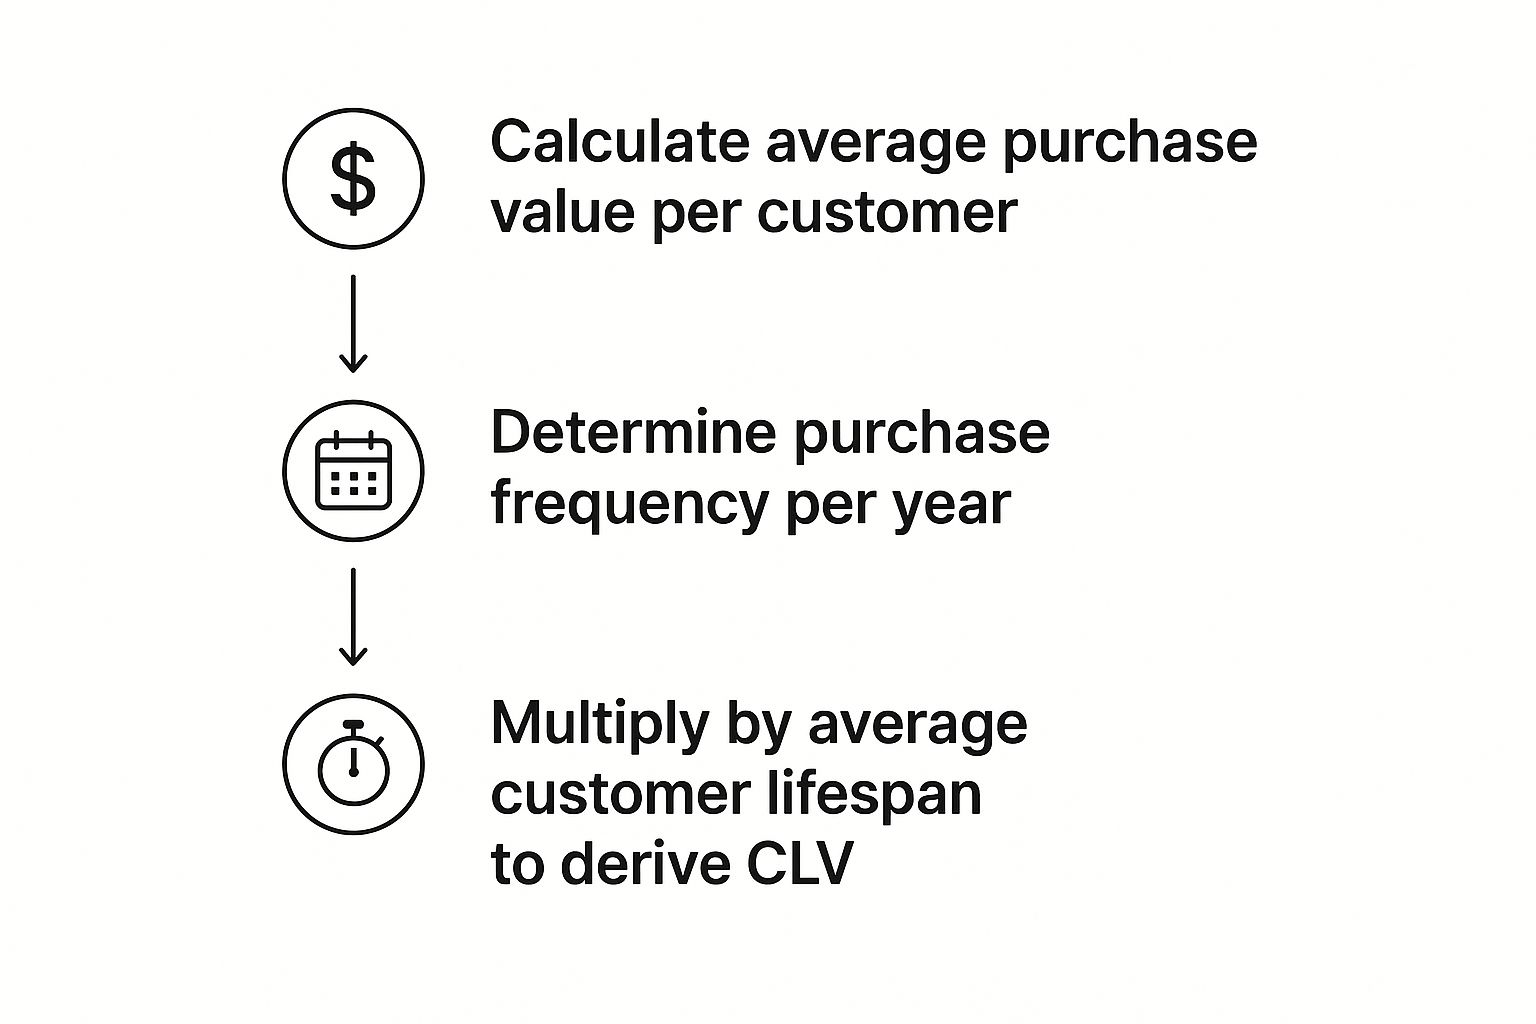
This process chart breaks down the simple, three-part flow for calculating CLV. It all starts with average purchase value, then moves to purchase frequency, and wraps up with the customer's lifespan.

As you can see, it's a direct line from individual customer actions to their long-term value. Let's dig into the formula itself and walk through a real-world example.
The formula is:
(Average Purchase Value × Purchase Frequency) × Average Customer Lifespan
This approach is popular for a reason—it strikes a perfect balance between simplicity and genuine insight. It helps businesses refine their retention strategies by understanding which customers are worth the most. With this knowledge, you can make smarter decisions, like offering premium support to high-CLV clients to keep them happy. Shopify's insights show just how powerful this calculation can be for all types of businesses.
A B2B SaaS Calculation Example
Let's ground this in a familiar B2B scenario. Imagine you run a SaaS company that sells project management software. To get your CLV, you just need to plug your specific numbers into the formula.
Before we do the math, here’s a quick look at what those components mean in a subscription model.
CLV Formula Components for a B2B SaaS Company
| Metric Component | Definition | Example Value |
|---|---|---|
| Average Purchase Value | The average monthly recurring revenue (MRR) per customer. | $500 per month |
| Purchase Frequency | The number of times a customer pays in a year. | 12 times (monthly) |
| Average Customer Lifespan | The average time a customer stays subscribed. | 3 years |
With these figures pulled from our example SaaS business, the calculation is incredibly simple.
First, you figure out the annual value of a customer:
$500 (APV) × 12 (F) = $6,000 per year
This tells you that, on average, a customer brings in $6,000 in revenue every single year. Not bad.
Next, you multiply that annual figure by how long a customer typically sticks around.
$6,000 (Annual Value) × 3 years (Lifespan) = $18,000
So, the Customer Lifetime Value for this B2B SaaS company is $18,000. This single number represents the total revenue you can realistically expect from a new customer over their entire relationship with your business.
This one metric is a game-changer. It tells your marketing team exactly how much they can spend to acquire a new customer and still remain profitable. It also shows your customer success team the dollar value they're protecting with every renewal.
This simple calculation is your first real step toward making truly data-driven decisions. To help you get started with your own numbers, we've created a straightforward spreadsheet template. Just plug in your own data for Average Purchase Value, Purchase Frequency, and Average Customer Lifespan to get an instant CLV estimate.
Advancing Your CLV For Deeper Insights

So, you've got a solid revenue forecast from the simple CLV formula. That's a great start, but it's missing a huge piece of the puzzle: profitability.
Let’s be honest—a high-revenue customer isn't always a high-profit one. Some clients demand a ton of resources, while others are low-touch and more lucrative. To get a real picture of your business's health, you need to factor in what it actually costs to win and keep each customer.
This is where we move from a revenue-based CLV to a profit-based CLV. The difference is night and day. It helps you zero in on which customers are truly driving your bottom line, not just inflating your top-line revenue.
Introducing Costs Into The CLV Formula
The next evolution of your CLV calculation brings two critical new metrics to the table: Gross Margin and Customer Acquisition Cost (CAC).
By adding these into the mix, you’re no longer just asking, "How much will a customer spend?" Instead, you're asking the much smarter question: "How much profit will this customer generate over their lifetime?"
Here’s the more advanced, profit-focused formula:
[ (Average Purchase Value × Purchase Frequency) × Gross Margin % ] × Average Customer Lifespan - CAC
It might look a bit more intimidating, but each new part adds a layer of invaluable insight. Let's break down the new additions so you can see why they matter so much.
- Gross Margin %: This is the percentage of revenue left after you subtract the cost of goods sold (COGS). For a B2B SaaS company, COGS could include things like server costs, third-party software licenses, or salaries for direct customer support. It tells you how profitable your core service really is.
- Customer Acquisition Cost (CAC): This one's simple. It’s the total cost of your sales and marketing efforts divided by the number of new customers you brought in during that time. It shows you exactly how much you spend, on average, to win a new client.
Why Profit-Based CLV Changes Everything
Let's run the numbers for a B2B manufacturing supplier to see this in action. Imagine you have two different customers, Company A and Company B.
On the surface, they look almost identical. Both spend $100,000 per year and stick around for five years. Using the simple formula, they each have a revenue-based CLV of $500,000. You'd probably treat them equally, right?
But now, let's bring in the costs.
| Metric | Company A | Company B |
|---|---|---|
| Annual Revenue | $100,000 | $100,000 |
| Customer Lifespan | 5 Years | 5 Years |
| Gross Margin | 60% (Standard products) | 40% (Custom products) |
| Customer Acquisition Cost | $20,000 (Acquired via inbound) | $50,000 (Acquired via trade shows) |
Time to recalculate their CLV with the profit-focused formula.
Company A (Standard Products):[ ($100,000 × 60%) × 5 years ] - $20,000 = $280,000
Company B (Custom Products):[ ($100,000 × 40%) × 5 years ] - $50,000 = $150,000
The results are stunning. Company A, which bought standard products and was cheaper to acquire, has a profit-based CLV almost twice as high as Company B. This is a game-changing insight you'd completely miss if you only looked at revenue.
This advanced calculation gives you the clarity to focus your resources where they'll have the biggest impact. You can now confidently invest more in marketing channels that attract "Company A" type clients and maybe rethink your pricing for custom jobs to better reflect their true cost.
It also drives home how vital customer retention is. A lower churn rate directly boosts the lifespan component of this equation, making every customer more valuable. For a deeper dive, it's worth checking out some SaaS churn rate benchmarks to see how your retention efforts stack up against the competition.
Putting Your CLV Insights into Action
Figuring out your customer lifetime value is a great start, but it's only half the battle. The real magic happens when you use that knowledge to make smarter, sharper business decisions. Once you know which customers are your most valuable, you can start shaping your marketing, sales, and service strategies to focus on what actually drives long-term growth.
This isn’t about broad, one-size-fits-all campaigns. It’s about precision. For example, if you discover your highest CLV customers are all from the tech industry or are mid-sized companies, your acquisition team now has a clear target. They can build hyper-focused campaigns to attract more prospects just like them. It’s about working smarter, not just harder.
Customer Segmentation and Personalization
One of the most powerful ways to use your customer lifetime value calculation is for segmentation. It's as simple as grouping customers into different tiers based on their CLV—think high, medium, and low value. From there, you can tailor how you engage with each group.
- High-Value Customers: These are your VIPs, the bedrock of your business. It's absolutely worth investing more to keep them happy. Think dedicated account managers, exclusive invites to beta programs, or personalized loyalty perks.
- Medium-Value Customers: Here, the goal is growth. Look for natural upselling or cross-selling opportunities that solve their evolving problems. Your goal is to methodically increase their lifetime value over time.
- Low-Value Customers: Efficiency is the name of the game here. Use automated check-ins and self-service resources to support them. This approach keeps them satisfied without draining the time your team could be spending on higher-impact activities.
When you know who falls into which bucket, you can allocate your resources intelligently and make sure your best customers get the white-glove treatment they've earned. Nurturing these key accounts is foundational, and you can dive deeper into this with our guide to the basics of customer relationship management.
Optimizing Marketing Spend with CLV to CAC
Your CLV data is also the perfect yardstick for measuring your marketing budget's effectiveness, especially when you look at the CLV-to-Customer Acquisition Cost (CAC) ratio. This simple metric tells you exactly how much value you’re getting back for every dollar you spend bringing in a new customer.
A healthy CLV-to-CAC ratio is generally seen as 3:1. In plain English, for every $1 you spend to acquire a customer, you should expect to get $3 back in lifetime value. If your ratio is dipping below that, it might be a sign you're overspending on acquisition.
This insight gives you surgical precision. Let's say your LinkedIn ads are bringing in customers with a 4:1 ratio, but the trade shows you attend only yield a 2:1 ratio. You now know exactly where to double down on your investment for the best possible return. It transforms marketing from a cost center into a predictable engine for growth.
A Few Common CLV Questions Answered
Once you start digging into customer lifetime value, a few questions always seem to come up. It's one thing to know the formulas, but it's another to apply them confidently and turn that data into real-world action. Let's walk through some of the most common hurdles I see B2B marketers run into.
How Often Should I Calculate CLV?
This is a great question. For most B2B companies, running the numbers on a quarterly or semi-annual basis is the sweet spot. This cadence is frequent enough to catch important trends and see if your big strategic bets are paying off, but not so often that you're getting bogged down by tiny, meaningless fluctuations.
Of course, there are exceptions. If your market moves at lightning speed or you’ve just rolled out a major marketing initiative, switching to a monthly calculation makes sense. It gives you a much tighter feedback loop to see what’s working right away.
What Is a Good CLV to CAC Ratio?
Everyone wants to know the magic number here. The widely accepted benchmark for a healthy CLV to Customer Acquisition Cost (CAC) ratio is 3:1. In simple terms, this means you’re making three dollars in lifetime value for every one dollar you spend to get a new customer.
A ratio way below 3:1 is a red flag. It could mean you're overspending on acquisition and burning cash. On the flip side, a really high ratio—say, 6:1—might sound great, but it could be a sign you’re not investing enough in growth and are leaving money on the table.
How Do I Calculate CLV for a New Business?
Calculating CLV without a few years of historical data feels a bit like navigating without a map, but it's totally doable. The trick is to shift from historical calculation to predictive modeling, using industry benchmarks and some smart assumptions.
You'll need to do a bit of research on your specific niche. Look for answers to questions like:
- What’s the typical customer lifespan for a service like ours? Look for churn rate data.
- How often do customers in this market renew contracts or make repeat purchases?
Use those industry averages as your starting point. Then, as your own customer data starts rolling in over the first year, make a habit of updating your CLV model. The more real data you have, the more accurate your predictions will become.

