

Email campaign performance metrics are the numbers that tell you if your email marketing is actually working. They're the feedback loop from your audience, showing you what they love, what they ignore, and where you can improve. Think of them as the vital signs for your entire email strategy.
Why Your Email Campaign Metrics Matter

Sending an email without tracking its performance is like driving with your eyes closed. You might be moving, but you have no idea where you're going or what obstacles are in your way. Tracking email campaign performance metrics turns guesswork into a data-driven strategy, transforming your inbox efforts from a cost center into a powerful growth engine.
This guide is about more than just sending emails. We're going to frame your campaigns as a crucial, measurable part of your business growth. When you understand what each metric reveals, you can fine-tune your approach, boost engagement, and ultimately drive more revenue.
The Power of Measurement
Email marketing consistently delivers an exceptional return on investment (ROI), making it one of the most effective channels out there. On average, the ROI for email is estimated to be between $36 and $42 for every $1 spent, which crushes the returns from most other marketing activities. This impressive figure is exactly why getting a handle on your performance metrics is so important. Discover more insights about email marketing ROI.
Your metrics are a direct line of communication from your audience. They tell a story:
- High open rates mean your subject lines are grabbing attention.
- Strong click-through rates show your content and calls-to-action are hitting the mark.
- Low unsubscribe rates prove your audience finds real value in what you send.
Think of your metrics as the dashboard of your marketing engine. They provide the real-time feedback needed to diagnose problems, identify opportunities, and steer your campaigns toward success. Without them, you’re just hoping for the best.
Key Email Performance Metrics At A Glance
Before we dive deep into each metric, let's start with a high-level overview. Each one provides a unique piece of the puzzle, and together, they paint a complete picture of your campaign's health and your audience's behavior. Understanding what each one is for is the first step toward mastering your email strategy.
Here’s a quick summary of the essential metrics we'll cover. This table outlines what each one measures and its primary goal, giving you a clear roadmap for what's ahead.
| Metric | What It Measures | Primary Goal |
|---|---|---|
| Open Rate | The percentage of recipients who opened your email. | Gauge subject line effectiveness and interest. |
| Click-Through Rate | The percentage of recipients who clicked a link. | Measure content engagement and relevance. |
| Conversion Rate | The percentage who completed a desired action. | Track the ultimate success of the campaign goal. |
| Bounce Rate | The percentage of emails that were not delivered. | Assess list health and sender reputation. |
| Unsubscribe Rate | The percentage of recipients who opted out. | Monitor audience satisfaction and relevance. |
| Campaign ROI | The total return on your marketing investment. | Determine the financial impact of your efforts. |
Now that you have the big picture, let's break down each of these key metrics one by one.
Tracking Your Core Engagement Metrics
Once your email lands in the inbox, the real work begins. Your core engagement metrics tell you what your audience is actually doing with your content. Think of it as moving beyond just sending a message to understanding the conversation you’re having with your subscribers. These numbers decode their actions and reveal the true impact of your campaign.
Let's break down the four essential metrics that form the bedrock of email campaign performance metrics: Open Rate, Click-Through Rate (CTR), Conversion Rate, and the incredibly insightful Click-to-Open Rate (CTOR). Each one answers a different, vital question about how well your campaign is hitting the mark.
Open Rate: What Catches Their Eye?
The Open Rate is simple: it’s the percentage of people who opened your email. This is the very first hurdle your campaign has to clear. A strong open rate is a direct reflection of your subject line's power, your sender name's trustworthiness, and whether you sent the email at the right time.
Imagine you're an e-commerce brand sending a "Weekend Flash Sale" email. A high open rate—say, 35%—suggests your subject line successfully created a sense of urgency and interest. A low one means you just didn't give subscribers a compelling enough reason to look inside.
Formula: (Number of Emails Opened / Number of Emails Delivered) x 100
A healthy open rate is your ticket to the rest of the engagement journey. Without it, even the most brilliant email content goes completely unseen.
Click-Through Rate: Was Your Content Compelling?
The Click-Through Rate (CTR) takes things a step further. It measures the percentage of your total recipients who clicked on at least one link inside your email. This metric tells you if your message, offer, and call-to-action (CTA) were engaging enough to inspire someone to act.
Ever seen a high open rate with a disappointingly low CTR? That’s a classic sign of a disconnect—your subject line wrote a check that your email content couldn’t cash.
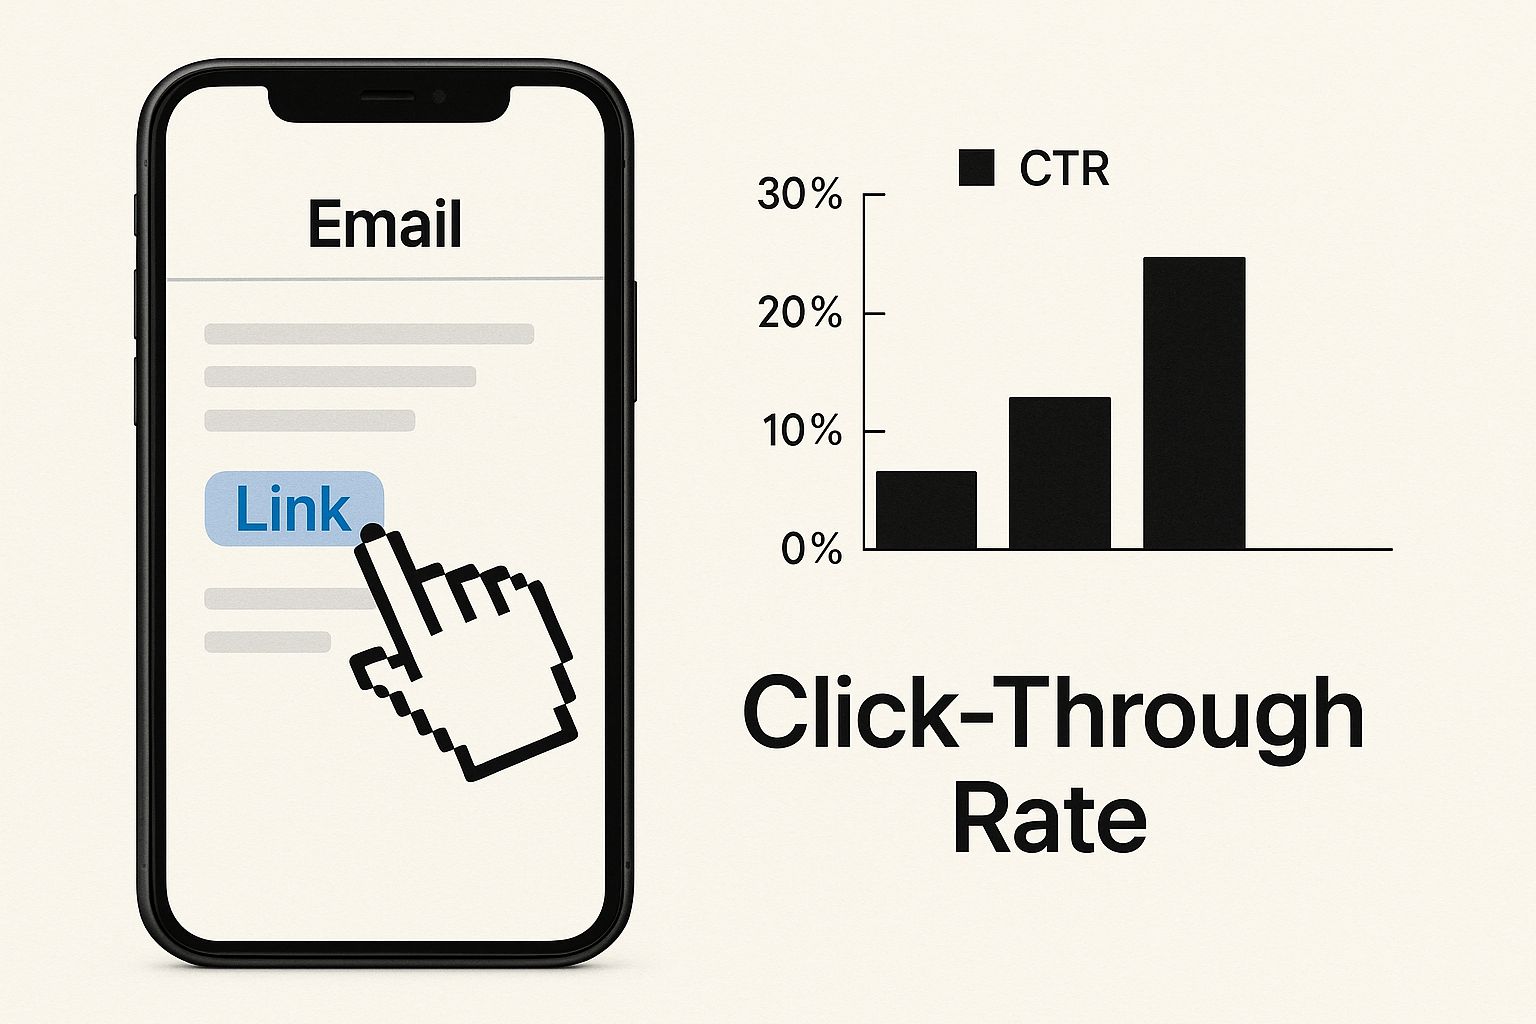
This image nails it: a click isn't just a random action. It’s a conscious choice from your audience, signaling that your message was not just opened, but was genuinely persuasive.
Formula: (Number of Unique Clicks / Number of Emails Delivered) x 100
It’s important to have realistic expectations for these numbers. Across industries, average open rates often land between 24% to 32.5%. Click-through rates naturally sit much lower, averaging around 3.25% to 3.5%.
Click-to-Open Rate: Gauging Content Quality
Now for my personal favorite, the Click-to-Open Rate (CTOR). This metric offers a much more nuanced view of your content's quality by comparing clicks to opens, not deliveries. In other words, CTOR focuses only on the people who actually saw your message.
This makes it an absolutely brilliant indicator of how engaging your email's copy, design, and offers truly are.
Formula: (Number of Unique Clicks / Number of Unique Opens) x 100
A high CTOR means the people who opened your email found the content highly relevant and actionable. It neatly separates your content’s performance from your subject line's performance, giving you a crystal-clear picture of what resonates with your engaged subscribers. To get a better feel for this, you can learn more about what makes a good click-to-open rate in our detailed guide.
Conversion Rate: Did They Complete the Goal?
Finally, we have the Conversion Rate—the ultimate measure of success. This tracks the percentage of recipients who not only clicked a link but also completed the desired action, whether that’s making a purchase, downloading a guide, or signing up for a webinar. This is where your email marketing efforts translate directly into business results.
Let’s say a SaaS company announces a new feature. The email's goal isn't just to get clicks; it's to get users to log in and try the feature. The conversion rate would measure exactly that, drawing a straight line from your email campaign to product adoption.
Formula: (Number of Conversions / Number of Emails Delivered) x 100
Comparing Core Engagement Metrics
To see how these all fit together, here's a quick side-by-side look. This table helps clarify what each metric is really telling you about your campaign's performance and your audience's behavior.
| Metric | Formula | What It Tells You |
|---|---|---|
| Open Rate | (Opens / Delivered) x 100 | How effective your subject line and sender name are at grabbing attention. |
| Click-Through Rate (CTR) | (Clicks / Delivered) x 100 | If your overall message was compelling enough to drive action from anyone who received it. |
| Click-to-Open Rate (CTOR) | (Clicks / Opens) x 100 | How engaging your email's content and CTA are to the people who actually opened it. |
| Conversion Rate | (Conversions / Delivered) x 100 | Whether your email successfully drove the final business goal (e.g., sales, signups). |
By tracking these four core metrics together, you move from simply observing data to understanding the complete story of how your subscribers engage with your brand.
How To Measure List Health and Deliverability

Even the most perfectly crafted email is useless if it never reaches an inbox. Your subscriber list is the absolute foundation of your email strategy, and its health directly impacts whether your campaigns succeed or fail. Key email campaign performance metrics are like a regular check-up, telling you if that foundation is solid or starting to crack.
Keeping an eye on list health isn't just about sending to more people; it's about sending to the right people. This means tracking bounces, managing unsubscribes, and making sure your list is always growing with engaged contacts. Let's break down the vital signs of a healthy email list.
Understanding Your Bounce Rate
Your Bounce Rate is simply the percentage of your emails that couldn't be delivered. Think of it like getting a "return to sender" stamp from the post office. But here's the thing: not all bounces are created equal, and knowing the difference is critical for staying in the good graces of inbox providers like Google and Yahoo.
There are two types of bounces you absolutely need to monitor:
- Hard Bounces: These are permanent delivery failures. They happen when you send to an invalid, closed, or flat-out non-existent email address. A hard bounce is a dead end.
- Soft Bounces: These are temporary hiccups. Common causes include a full inbox, a server that’s temporarily down, or an email that’s too large.
A few soft bounces now and then are normal. A high hard bounce rate, however, is a massive red flag. It signals to email providers that your list is old and poorly maintained, which can wreck your sender reputation and send your future emails straight to spam.
Why You Need To Manage Bounces
Consistently sending emails to bad addresses is like knocking on the door of an abandoned house over and over. Pretty soon, the whole neighborhood (in this case, inbox providers) starts to see you as a nuisance. A bounce rate below 2% is generally considered healthy, but you should always be aiming for as close to zero as you can get.
The single most effective way to crush your hard bounce rate is to practice good list hygiene. This means regularly cleaning your list of invalid addresses and using verification tools to make sure new sign-ups are legit from day one.
Proactively managing your list is non-negotiable. To get a jump on this, it's worth understanding why email verification is essential for B2B campaigns and how it directly props up your deliverability and success.
Interpreting Your Unsubscribe Rate
The Unsubscribe Rate measures the percentage of people who opt out of your list after receiving an email. It might sting a little, but a low and steady unsubscribe rate can actually be a good thing. It means you’re filtering out people who are no longer interested, leaving you with a more engaged audience.
Formula: (Number of Unsubscribes / Number of Emails Delivered) x 100
A very low rate—somewhere below 0.1%—is a great benchmark. But if you see a sudden spike in unsubscribes after a particular campaign, treat it as valuable feedback. It’s a clear signal that your message or offer missed the mark, giving you a chance to adjust your strategy for next time.
Tracking Your List Growth Rate
Finally, your List Growth Rate shows how quickly your email list is expanding. A healthy list should always be growing, because it’s natural to lose some subscribers over time to unsubscribes and inactivity. This metric ensures you're constantly bringing fresh, interested leads into the fold to replace the ones you've lost.
To calculate it, just use this simple formula:
Formula: ([(Number of New Subscribers – Number of Unsubscribes) / Total Number of Subscribers] x 100)
By keeping a close watch on these three metrics—Bounce Rate, Unsubscribe Rate, and List Growth Rate—you get a complete picture of your list's health. This allows you to protect your sender reputation, keep deliverability high, and make sure your brilliant campaigns always reach an audience that wants to hear from you.
Connecting Email Performance To Revenue
Opens and clicks are great for gauging interest, but they don't pay the bills. If you really want to prove the value of your email marketing, you have to connect your campaigns directly to the bottom line. This is where financial email campaign performance metrics become your secret weapon, turning your email program from a simple communication channel into a legitimate revenue driver.
Don't worry, tracking the financial impact isn't as scary as it sounds. By zeroing in on a few key calculations, you can draw a straight line from an email you sent to the sales it generated. This lets you speak the language of the C-suite and make a rock-solid case for more budget and resources.
Calculating Revenue Per Email
The most direct financial metric you can track is Revenue Per Email (RPE). This simple calculation tells you exactly how much money a single email campaign brought in all on its own. It’s perfect for measuring the success of a specific promotion, a new product launch, or a big sales announcement.
To figure it out, you just need two numbers: the total revenue from the campaign and the number of emails that were actually delivered.
Formula: Total Revenue from Campaign / Number of Emails Delivered
Of course, this only works if you have proper conversion tracking set up between your email platform and your e-commerce store. Without it, you're just flying blind. But before you can even think about revenue, you have to make sure your emails are getting to the inbox in the first place. Understanding what email deliverability is and how to boost it is the essential first step.
Measuring Revenue Per Subscriber
While RPE is fantastic for individual campaigns, Revenue Per Subscriber (RPS) gives you a much broader look at the overall value of your list. This metric helps you understand what each person on your email list is worth, on average, over a set period like a month or a quarter.
It’s an excellent way to gauge the long-term health and profitability of your entire email program. If your RPS is climbing, it’s a clear sign you’re getting better at sending your audience relevant offers they actually want.
Formula: Total Revenue from Email Over a Period / Total Number of Subscribers
This metric is incredibly useful for making bigger strategic decisions. For instance, if you know the average subscriber is worth $2.50 a month, you can confidently decide how much you’re willing to spend to acquire a new lead.
Putting It All Together: A Holiday Promotion Example
Let's make this real. Imagine an e-commerce store sends a holiday promotion to its list of 10,000 subscribers.
Here’s a quick breakdown of the costs and results:
- Total Campaign Cost: $300 (This covers a slice of the ESP subscription and the designer’s time).
- Emails Delivered: 9,800 (200 of them bounced).
- Total Revenue Generated: $6,000 (Tracked directly from clicks in the email).
With this data, we can calculate the campaign's key financial metrics in seconds.
- Revenue Per Email (RPE): $6,000 / 9,800 emails = $0.61 per email
- Campaign ROI: (($6,000 – $300) / $300) x 100 = 1900% ROI
This simple analysis proves the campaign was a home run, bringing in $19 in revenue for every single $1 spent.
Proving Your Campaign ROI
The ultimate metric for any marketing effort is Return on Investment (ROI). This calculation shows you exactly how much profit your email campaign generated compared to what it cost to run. It's the single most persuasive number you can share to show the financial success of your work.
A positive ROI means your campaign made more money than it cost. A sky-high ROI, like the 1900% in our example, is undeniable proof that email is an incredibly efficient and profitable channel for the business.
Mastering these financial metrics elevates you from someone who just sends emails to a strategist who manages a core business asset. By tying your work directly to revenue, you provide undeniable proof of your impact.
Actionable Strategies To Improve Your Metrics
Analyzing your data is the first step, but real growth happens when you turn those insights into action. Knowing your email campaign performance metrics is only half the battle; improving them is how you win. This section is a practical playbook of proven strategies you can implement right away to boost your results.
Think of each metric as a lever. When one is underperforming, you need to know which lever to pull to fix it. We’ll organize these tactics by the specific goal you want to achieve, giving you a clear path from problem to solution.
How To Boost Your Open Rate
Your open rate is the gateway to everything else. If subscribers don't open your email, your brilliant content and compelling offers might as well not exist. The key is to build curiosity and trust right from the subject line.
- A/B Test Your Subject Lines: This is the single most effective way to learn what resonates with your audience. Test different approaches: short vs. long, questions vs. statements, or using emojis vs. no emojis. Let your audience’s behavior tell you what works.
- Segment Your Audience: A generic message gets a generic response. Group your list based on past purchase history, engagement level, or location to send highly relevant content that subscribers are actually eager to open.
- Optimize Your Sender Name: Use a recognizable name, whether it’s your brand name or a person from your company (e.g., "Jenna at B2B Verifier"). Consistency builds trust and makes your emails stand out in a crowded inbox.
The goal isn't just to get an open; it's to deliver on the promise your subject line makes. A clickbait-style subject line might work once, but it erodes trust and hurts your long-term engagement.
How To Increase Your Click-Through Rate
Once they've opened the email, the next challenge is to inspire action. A strong click-through rate (CTR) shows that your message was compelling and your call-to-action (CTA) was crystal clear. If your CTR is lagging, it’s time to focus on your content and design.
- Craft a Single, Clear CTA: Don’t overwhelm subscribers with too many choices. Focus each email on one primary goal and make your CTA button bold, action-oriented (e.g., "Shop the Sale Now"), and impossible to miss.
- Use Visually Engaging Content: Break up text with high-quality images, GIFs, or even embedded videos where appropriate. Visuals draw the eye and can often communicate your offer more effectively than words alone.
- Personalize the Content: Go beyond just using their first name. Personalization can dramatically improve performance. In fact, emails with personalized subject lines are 50% more likely to be opened, and personalized CTAs can lead to 42% higher conversion rates. This reflects a clear preference for tailored communication, as 55% of consumers want emails with offers relevant to their interests. Discover more insights about email personalization on Klaviyo.com.
How To Decrease Your Unsubscribe and Bounce Rates
Losing subscribers is a natural part of email marketing, but high unsubscribe and bounce rates are red flags pointing to deeper issues. Keeping your list healthy is crucial for long-term success and protecting your all-important sender reputation.
A high bounce rate is often a direct result of poor list quality. It signals to inbox providers that you aren't maintaining your contacts, which can seriously damage your deliverability. Regularly cleaning your list is non-negotiable. For a deeper dive, check out our practical guide to email list cleaning to learn the best practices for keeping your contacts fresh and valid.
To keep your lists healthy and your subscribers happy, focus on these key areas:
- Set Clear Expectations at Sign-Up: Be upfront about what kind of content you’ll be sending and how often. This ensures you’re attracting subscribers who are genuinely interested in what you have to offer.
- Offer Preference Options: Allow subscribers to choose the types of emails they receive or adjust the frequency. Giving them control makes them far less likely to hit the unsubscribe button out of frustration.
- Run Re-engagement Campaigns: Before you purge inactive subscribers, send a targeted campaign to try and win them back. A simple "Are you still interested?" email can reactivate a surprising portion of your dormant list.
Common Questions About Email Metrics
Diving into email metrics can feel a bit like learning a new language. You get the basics, but then specific situations pop up and leave you scratching your head. This section is designed to give you clear, straight-up answers to the most common questions marketers have when they start digging into their campaign performance.
Think of this as your quick-reference guide for those "what does this actually mean for me?" moments. These answers will help clear up the confusion and give you solid advice for the challenges you'll run into.
What Is a Good Open Rate for an Email Campaign?
Everyone wants to know the magic number for a "good" open rate, but the truth is, there isn't one. It can swing wildly depending on your industry, your audience, and what kind of email you’re sending. That said, a general benchmark many marketers keep in their back pocket is somewhere between 20% and 30%.
Some industries, like non-profits, often see much higher rates because their subscribers are genuinely invested. On the other hand, a competitive e-commerce brand sending out daily deals might see lower opens simply due to the sheer volume of their emails.
The best benchmark is always your own past performance. The real goal isn't hitting some arbitrary industry average—it's achieving steady improvement over time. That’s the true sign of a healthy email strategy.
And remember, never look at the open rate in a vacuum. You always want to pair it with the Click-to-Open Rate (CTOR). A high open rate with a rock-bottom CTOR is a classic red flag. It usually means your subject line wrote a check that your email content couldn't cash.
How Often Should I Check My Email Campaign Metrics?
The right frequency for checking your metrics really depends on the campaign you’re running. There’s no one-size-fits-all schedule, but you can follow a few rules of thumb to stay on top of things without getting bogged down in the data.
For time-sensitive campaigns, you need to be watching closely:
- Flash Sales or Limited-Time Offers: If you’re running a 24-hour sale, you should be monitoring metrics in near real-time. A quick check every few hours can help you spot problems early enough to do something about it, like resending to non-openers with a punchier subject line.
- Event Reminders: For a webinar or live event, check your numbers shortly after the email goes out. This gives you a quick read on initial interest and how fast registrations are coming in.
For your more routine emails, a less frequent check-in is perfectly fine:
- Weekly Newsletters: Most of the action happens in the first 24-48 hours. Give it a day or two, then dive in to see how it performed.
- Automated Drip Campaigns: Since these run in the background, a monthly review is usually enough to make sure they’re still hitting the mark and staying relevant.
No matter what, make sure you schedule a dedicated monthly or quarterly review of your entire email program. This is where you zoom out to spot long-term trends, see how your audience is evolving, and make smart, strategic decisions instead of just reacting to the daily ups and downs.
Which Single Metric Is the Most Important to Track?
This question comes up all the time, but the answer is always the same: the most important metric is the one tied to your campaign goal. Chasing the wrong metric is a fast track to misinterpreting your results and making bad decisions.
Before you even think about hitting "send," you have to know why you're sending the email in the first place. Once you nail down the "why," figuring out "what" to measure becomes easy.
Here’s how different goals line up with different metrics:
- Goal: Build Brand Awareness: If you're sending a newsletter with company updates or interesting content, your main focus should be Open Rate and Click-Through Rate (CTR). Success here means you grabbed their attention and got them curious enough to learn more.
- Goal: Drive Sales: For a promotional email, it’s all about the money. The only metrics that truly matter are Conversion Rate and Revenue Per Email (RPE). These tell you if your email actually drove sales.
- Goal: Re-engage Inactive Subscribers: Trying to win back folks who’ve gone quiet? Your north star is the Click-to-Open Rate (CTOR). A rising CTOR shows that your message is successfully reigniting interest among people who had tuned you out.
When you define your goal first, you bring instant focus to your analysis. The metric that directly measures that goal is always the most important one for that campaign.
How Do I Calculate the ROI of My Email Marketing?
Figuring out the Return on Investment (ROI) of your email marketing is the ultimate way to prove its worth. This is the metric that gets leadership's attention because it moves beyond clicks and opens to show the direct financial impact of your work. The formula itself is refreshingly simple.
ROI Formula: [(Revenue from Email – Cost of Email) / Cost of Email] x 100
To get your number, you just need to track down two things:
- Revenue from Email: This is the total amount of sales generated by your campaign. Most email platforms and e-commerce systems can track this for you by attributing purchases back to a click in a specific email.
- Cost of Email: Tally up all the related costs. This should include a slice of your email platform subscription, any money spent on design or content, and the cost of the time your team spent putting it all together.
Let’s walk through a quick example. Say you brought in $5,000 in sales from a campaign that cost you $200 to create and send.
Your math would look like this: [($5,000 – $200) / $200] * 100 = 2400% ROI.
Any positive ROI proves your email marketing is a profitable channel. But an impressive figure like 2400% provides undeniable proof that your email program is a serious revenue driver for the business.